How to Use Website Uptime Monitoring by CleanTalk
To connect a website to the Uptime Monitoring by CleanTalk please do the following:
1. Go to Website Uptime Monitoring Dashboard
2. Click the button "Add monitor"
3. Enter the website's URL (you can add multiple entries separated by commas or by new lines) and select the options you want

1. Website's URL
2. Website HTTP request method:
• HEAD - Optimal. Doesn't create additional load on the website. This method doesn't return HTTP website errors.
• GET - This method can cause additional load on the website. The method returns HTTP website errors and can be used for additional diagnostics.
3. Website check interval — You can choose the time period for the test requests needed for checking your website
4. How much time to wait before sending you warnings by email that the website stopped being accessible
5. Choose checkpoints to monitor your website's URL from
4. After your website has been added you'll see information about its status:
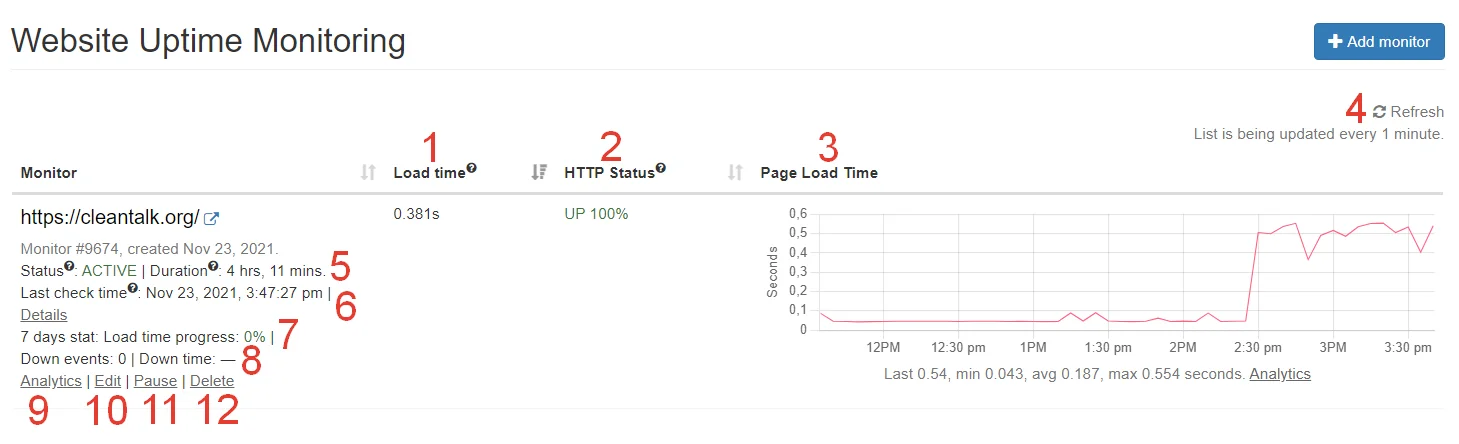
1. Load time — when was the last time the website pages were loaded
2. HTTP Status — website availability on the Internet
3. Page load time — average load time of the website pages
4. Refresh — click it to update all data on the page
5.1 Status of monitoring:
- Active — the monitoring service is active
- Pause — the monitoring service is paused
5.2 Duration — how much time has passed since the last change of the HTTP status
6. Last check time — when the website was checked the last time
7. 7 days stat — average value of the loading time for the last 7 days
8.1 Down events — how many times the website was unavailable
8.2 Down time — sum of how much time the website was unavailable
9. Analytics — detailed statistics
10. Edit — change monitoring settings
11. Pause/Activate — start or pause the monitoring service
12. Delete — delete this monitor of the website
Analytics
Click the link "Analytics" to see the monitoring details of your website:

You can choose which time periods the analytics tool will be displayed for (1 day, 7 days or custom dates). Also, you can download the graph in PNG format.
Page Load Time
On this chart you can see the page load time of your website from four different geographical points:
- US West
- US East
- Europe
- Asia Pacific
Website availability is being checked from each geographical point once a minute. Each point gives its result according to the following checks:
- http_response_code — HTTP server response code: https://en.wikipedia.org/wiki/List_of_HTTP_status_codes
- http_full_response_time — the total response time of the website, consists of DNS query + Connection time + Backend response time
- http_server_ip — IP address of the webserver of the website
- http_response — HTML content provided by the webserver
To see the page loading time for a certain checking point, please move your mouse pointer to this area on the chart:

Last Events
In this section you can see the detailed statistics about the website events:

1. Event — shows if your website is accessible or not:
- UP — the website is accessible
- DOWN — the website is not accessible, this status is shown if at least one of the geographical points could not access the website
- PAUSE — monitoring is paused
2. Date/Time — the time when the event started
3. Duration — how long the event lasted
4. Export events section — choose the file format of the exported data
5. More details:

1. Checkpoint server location.
2. Website server details.
3. Website response code.
4. Website response time.
Email Notifications
You will receive a notification by email each time the website status changes — when the website became unavailable and when it was recovered.
Weekly Report with the summary data — shows the dynamics of changes in the data relative to the last week, what parameters have been increased or decreased.
It would also be interesting
- CleanTalk Anti-Spam monitoring_services_get API MethodCleanTalk Anti-Spam "monitoring_services_get" API method description This method returns list of resources...
- How to Receive WhatsApp Alerts for UptimeMonitoring EventsHow to Receive WhatsApp Alerts for UptimeMonitoring Events Want to be instantly alerted about your website's...
- How to delegate Monitoring rights to other users and add email for reportsDelegation of Monitoring to Other CleanTalk Users, Additional Email Address for Reports 1. Enter your...